User Interface
Workbench Overview
AnyAutomation Studio uses the familiar editor workbench layout, divided into several areas:
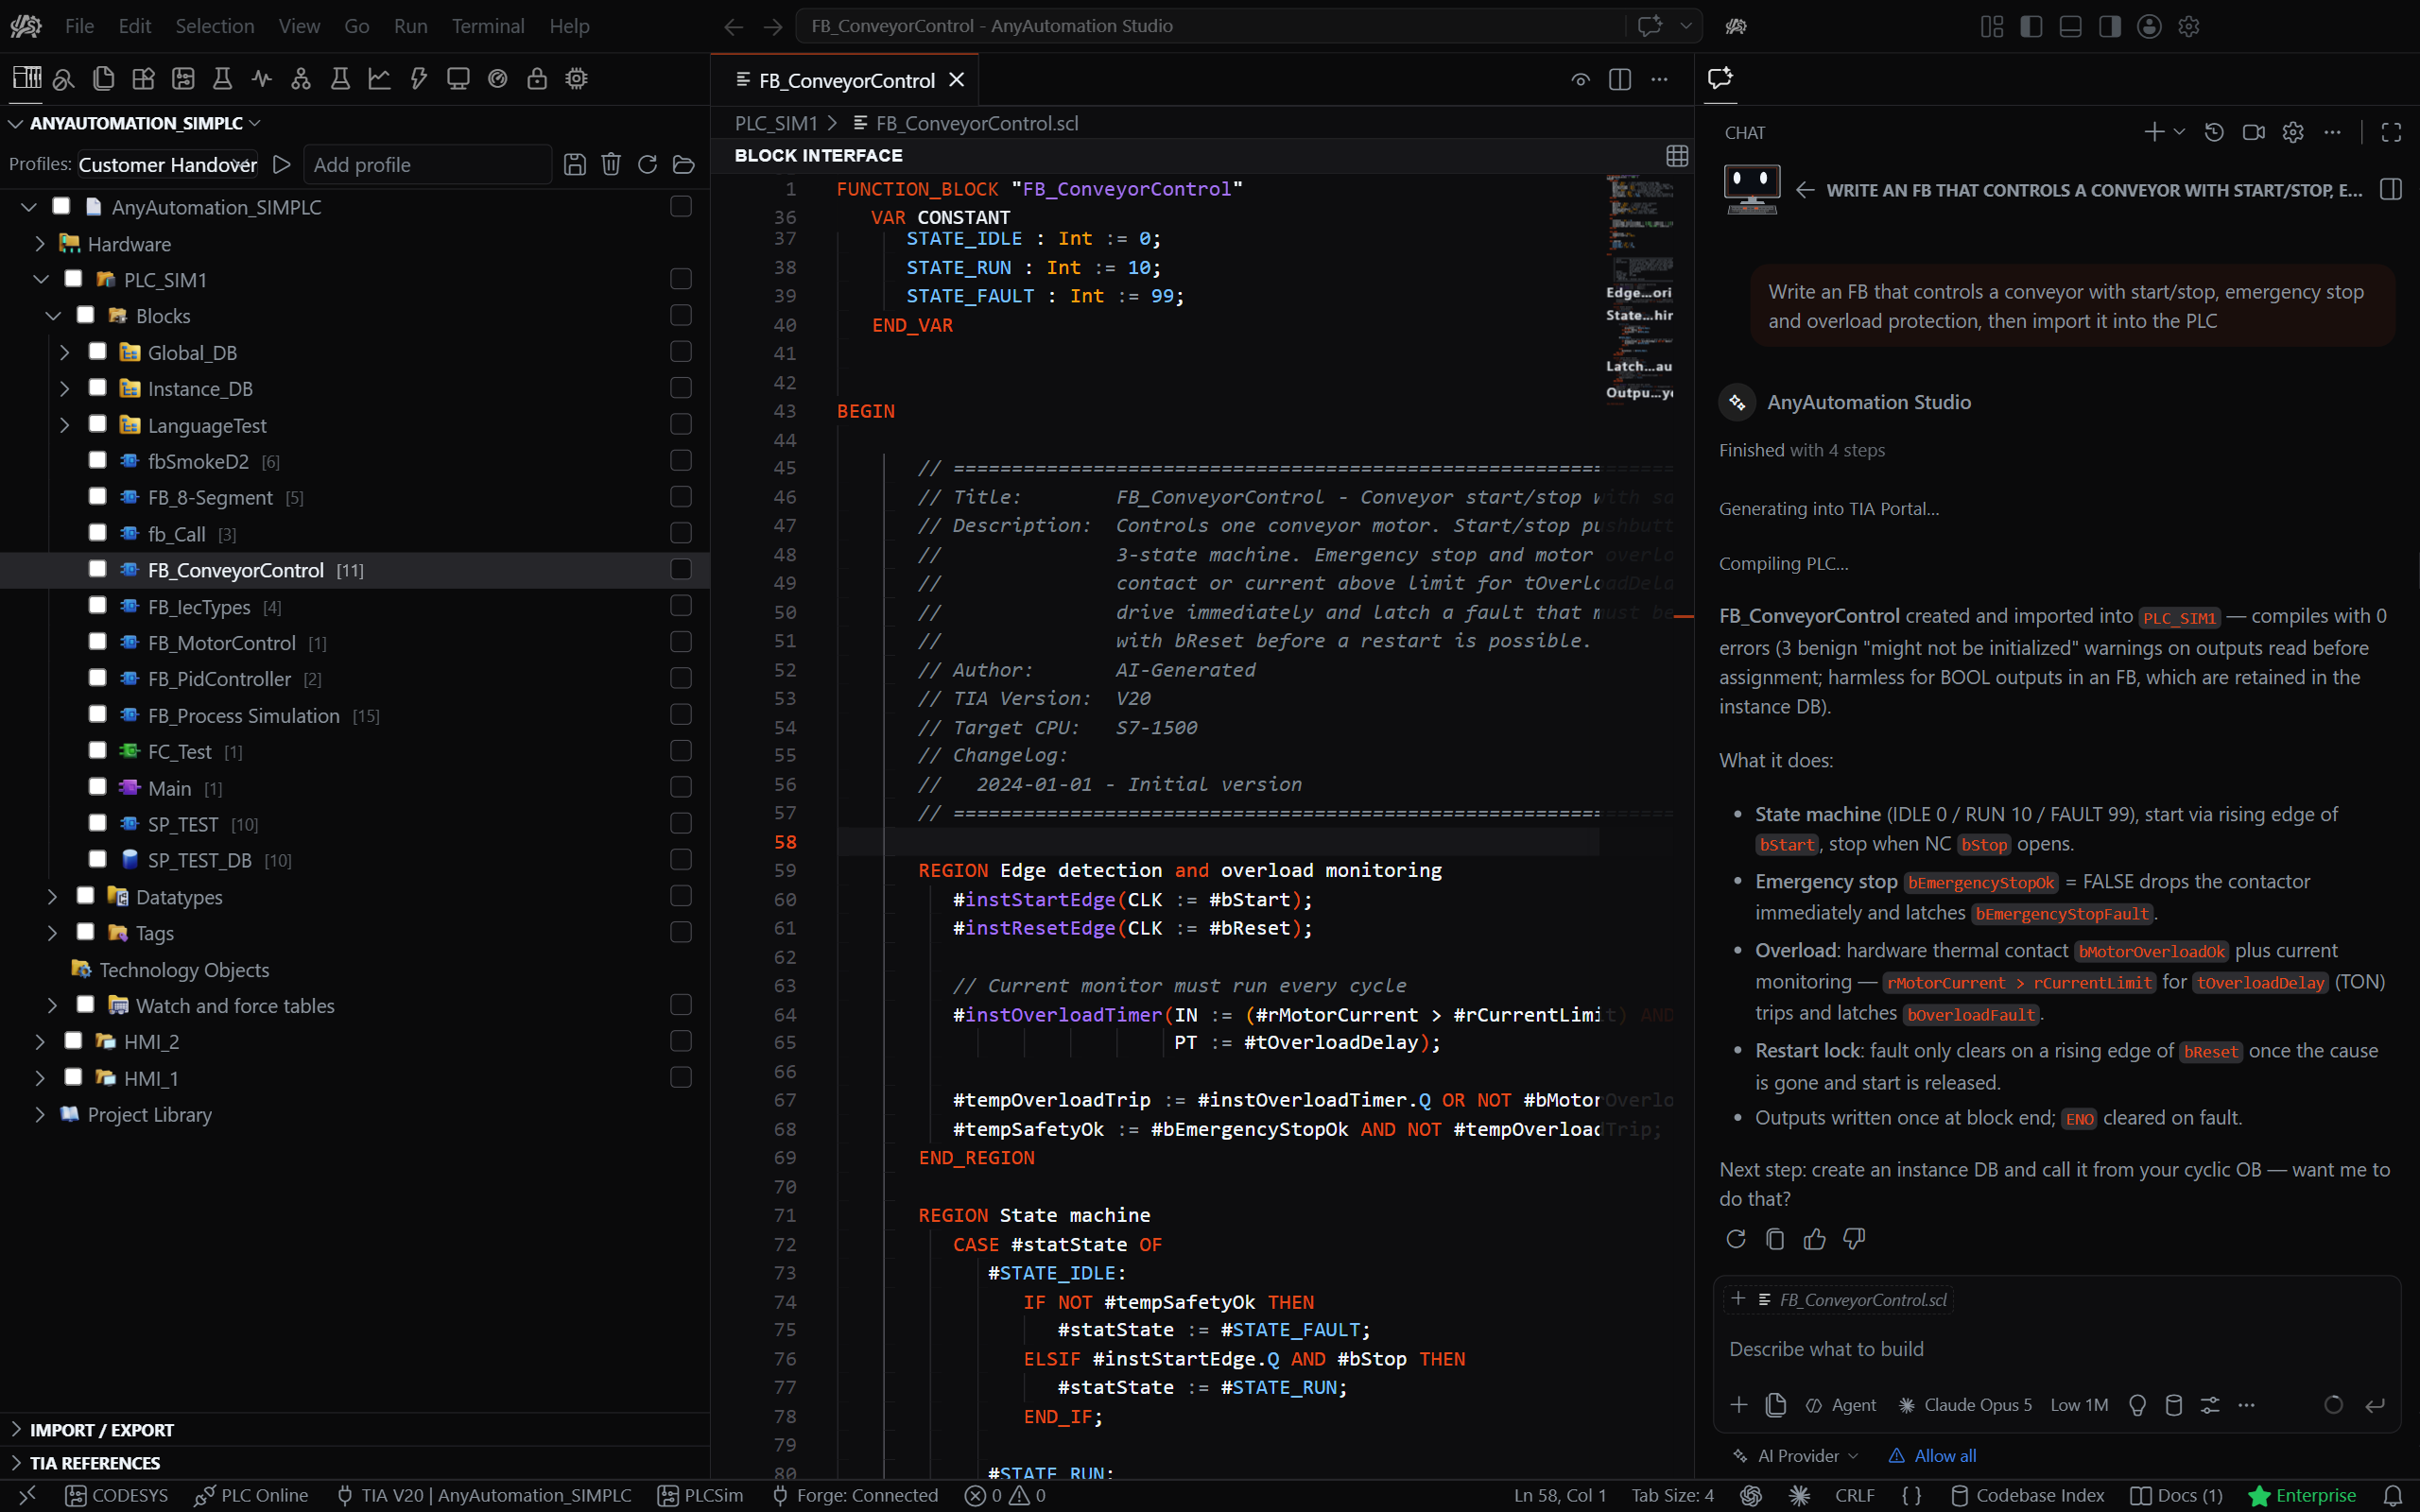
- Activity Bar (far left) — a vertical strip of icons, one per view container. It hosts the TIA Portal container (PLC-rack icon, holds the project tree and the connection), the PLC Online container, the built-in Explorer, Search and Source Control, and any installed extensions.
- Side Bar (left) — shows the views of the active container, such as the TIA Project Explorer tree.
- Editor area (center) — blocks and panes open here as editors, side by side or split.
- Panel (bottom) — Output, Problems, and Terminal.
- Status Bar (very bottom) — the connection state with the TIA version and project name (plus the instance count when several are attached) and the license badge.
Activity Bar
Each icon in the Activity Bar opens either a view container in the Side Bar or, for a feature that works in a page of its own, that page directly in the editor area. A page icon leaves the Side Bar as it is: whatever it showed before keeps showing, and a hidden Side Bar stays hidden. Selecting the icon again brings the open page back to the front.
| Icon | Opens |
|---|---|
| PLC rack | TIA Portal: Project Explorer, Import / Export, and TIA References in the Side Bar |
| Search-stop | Find Unused: the Find Unused page; the scan starts when you select Find All Unused |
| Two documents | Compare Editor: the Compare Editor page; pick what to compare there and select Compare |
| Magnifier with wavy line | Project Search: the Project Search page for searching the content of the blocks in the open project |
| Pulse | PLC Online: the PLC Online view with the live address-space tree |
| Line graph | Trace: the Trace page for recording OPC UA signals |
| Virtual machine | PLCSim Advanced: the PLCSim Advanced dashboard |
| Padlock | Password Vault: the Password Vault page |
| Dashboard | SCADA: the SCADA side bar with the views Project, Signals, Pages, Symbols and Rules |
| Files | Explorer: the workspace file tree |
| Magnifier | Search: text search in the files of the workspace |
| Source-control | Source Control: Git status, staging and commits |
Clicking the TIA Portal icon opens its Side Bar with the Project Explorer above the Import / Export view; the collapsed TIA References view fills in when you run Find References on a block.
Side Bar — Project Explorer
- Shows the structure of the opened TIA Portal project
- Hierarchy: Project → Hardware → Source → PLC → Blocks/Datatypes/Tags
- Checkboxes enable multiple selection for export
Editor area
Documents and panes open in the central editor area as tabs, the same way text files do. You can open several at once and arrange them side by side (see Workspace Layout). When word wrap is on, Editor › Word Wrap Indicator in the settings marks every wrapped line with an arrow at the wrap column:
- Block source: double-click a block in the Project Explorer to open its read-only SCL / STL / graphical source in an editor.
- Import / Export: the workspace for file operations, opened from the TIA Portal Side Bar.
- Compare Editor: compare a project against a second project or against a folder on disk (your export folder, or any folder you pick); the Compare Editor icon in the Activity Bar opens it directly, and Compare runs the comparison you pick on the page. The status counts above the result list (Changed, Only in either side, Unchanged, Inconsistent, Does not exist) are clickable filters: click one to narrow the list to that status, click again to release it, and combine them with the block-type chips and the name filter. When you compare against a folder, the first comparison exports the PLC once; later comparisons check the PLC for changed items and export only those, also after a restart of Studio. After Import Selected the result refreshes on its own without exporting the whole PLC again.
- Find Unused: dead-code detection and cleanup; the Find Unused icon in the Activity Bar opens it directly, and Find All Unused starts the scan once a TIA project is connected (see Find Unused Blocks).
- Project Search: full-text search through the content of every block and tag table; the Project Search icon in the Activity Bar opens it directly, and Search is available once a project is open, connected or opened offline (see Project Search).
- TIA References: where-used results for a block; opens from Find References on a block.
- Trace: a real-time scope for OPC UA signals; the Trace icon in the Activity Bar opens it directly (see Trace).
- Password Vault: encrypted storage for know-how-protection passwords; the padlock icon in the Activity Bar opens it directly (see Password Vault).
- PLC Online: the OPC UA / S7 online editor (one pane, multiple PLCs as inner connection tabs).
- PLCSim: the PLCSim Advanced control pane (available on Pro and above); the PLCSim Advanced icon in the Activity Bar opens it directly (see PLCSIM Advanced).
Integrated browser
Web pages can be opened inside Studio instead of in your external browser:
- Open it – View → Browser, or Open Integrated Browser in the Command Palette. A browser tab opens in the editor area, where you type or paste an address. Ctrl+Alt+/ opens it as well and, once browser tabs are open, lists them for you to switch.
- A saved web page from disk – right-click an
.html,.htm,.mhtor.mhtmlfile in the Explorer and choose Open in Integrated Browser. The same entry sits in the editor title bar, and Open With… offers Integrated Browser for these files. - Spelling – in a text field of a page, right-click a misspelled word for the suggested corrections, and Add to Dictionary to keep the word for the future.
Which browsing data the tabs share is set in Settings (Ctrl+,) with Data Storage under Workbench › Browser. Choose agent and your browser tabs share one session with the pages the assistant opens, so both see the same signed-in state; that also means the assistant can read the cookies and stored data of that session. The session is dropped when you close Studio.
Command Palette and Quick Open
- Command Palette — press Ctrl+Shift+P to find and run any command by name, including every TIA Portal command (Connect to TIA Portal, Compile Project, Export Selected, Import Selected, and so on).
- Quick Open — press Ctrl+P to jump to a file by name.
- Settings — press Ctrl+, to open Settings; type a prefix such as
tiaPortalto filter to this product's options.
Documentation
Open this manual from Help → AnyAutomation Documentation (or the AnyAutomation Documentation command in the Command Palette). It opens anyautomation.ch/docs in your browser, where you can search, switch language, and follow cross-links between pages.
Panel
The bottom panel contains:
- Output — application log messages with color-coded severity, with a dropdown to pick the log channel.
- Problems — diagnostics aggregated across open editor files; every row shows the file name with line and column, and a click jumps the editor to that exact location.
- Terminal — integrated terminal for command-line operations.
The panel can be collapsed, expanded, or maximized using the controls in its top-right corner, and moved to the left, right, or bottom of the window (see Workspace Layout).
Copying Values from Data Fields
Read-only data fields throughout the application can be selected with the mouse and copied with Ctrl+C like any text input. This includes CPU identity (MLFB, serial number, firmware), OPC UA diagnostics (server build, session counters, capabilities), license information (account email, hardware ID, expiry date), connection details (endpoint URL, IP address, security mode), and error or status messages. Static field labels are not selectable; values are.
Copying Data Out of the PLC Online Pane
The grids in the PLC Online pane let you get values out for a spreadsheet, ticket, or chat:
- Address-space tree — right-click a node for Copy Node ID and Copy Browse Path.
- References grid — right-click a row for Copy Node ID, Copy Browse Name, or Copy as JSON.
- Watch table — right-click a row for Copy Node ID, or use Export CSV in the table toolbar to write all rows to a
.csvfile. - Event log — use Export CSV in the toolbar to write the captured events to a
.csvfile.